At O’Neil Global Advisors, in addition to fundamental research on companies, a substantial part of our process of analyzing ideas is looking at those breaking into new highs, and conversely, breaking down below key support levels.
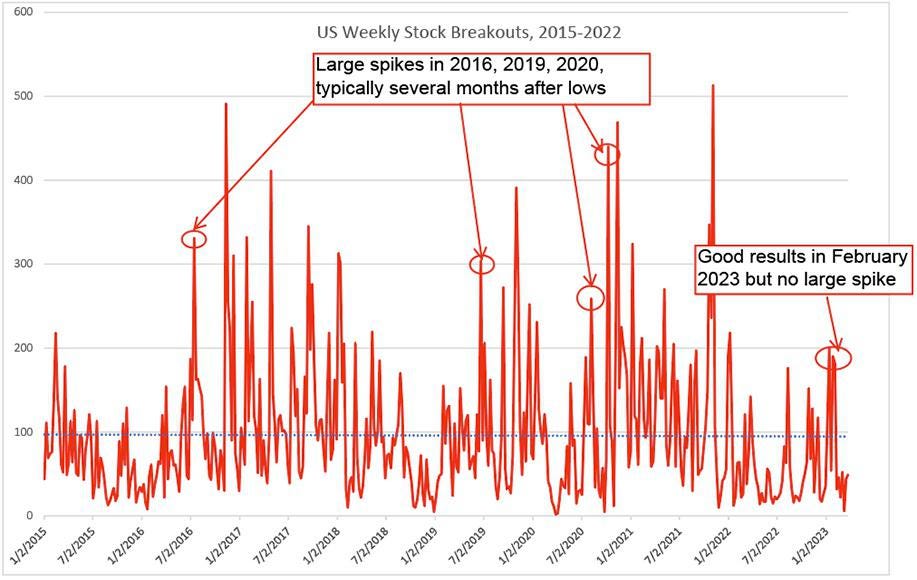
In terms of breakouts, we have talked about the need for the count to rise substantially to gain confidence in a sustained stock market uptrend (see article from February 2023). Since August 2022, there have been several short-term surges in the breakout totals. Still, a bigger surge has been present in past cycles to mark the “all clear” signal for the market. For instance, in July 2016, about five months after recent market lows, the weekly total jumped to over 300 breakouts and then followed through consistently throughout 2017. In June 2019, about six months after the market lows, the total jumped to over 300, and led to a very strong market for the next 6-8 months. In August 2020, five months after the lows, the total jumped to 260 and led to another 15+ months of upside in the market.
Support authors and subscribe to content
This is premium stuff. Subscribe to read the entire article.


